Log interpretation & correlation
Lesson Summary
Learn how to read GR, resistivity, density, and neutron logs to differentiate between formations and fluids, then correlate the same layer between two wells.
This lesson is part of the Formation Evaluation track and lasts 15:01 minutes. Watch the video first, then review the key points and test your understanding with the questions below.
Key Points
- 1High GR usually indicates shale
- 2High resistivity in a porous layer may indicate hydrocarbons
- 3Density-neutron crossover is a gas indicator
- 4Correlation depends on curve patterns, not just depth
Written Lesson
How are logs recorded?
Wireline Logging involves lowering tools on a cable into the borehole and then pulling them up slowly at a constant speed; the tools record continuous measurements versus depth. The result is a set of curves read together to determine rock type, bed thickness, and fluid presence.
Key Measurements
- Gamma Ray (GR): Differentiates between shale (high reading) and clean sand or carbonates (low reading).
- Spontaneous Potential (SP): Natural electrical potential that helps detect permeable beds and estimate water resistivity Rw.
- Caliper: Measures borehole diameter, revealing washouts and data quality.
- Resistivity (Resistivity): High in hydrocarbon-saturated layers, low in saltwater-saturated layers.
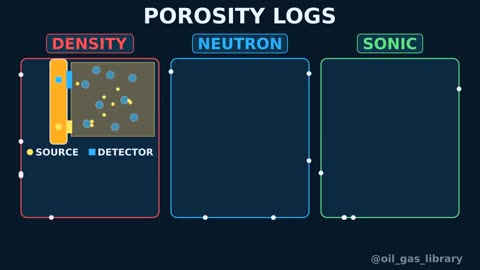
- Density (Density) and Neutron (Neutron): Estimate porosity and help distinguish between gas and liquids.
- Sonic (Sonic): Measures sound travel time through rock, useful for porosity and fracture detection.
Density-neutron crossover is a famous gas indicator: in a gas zone, the neutron log reads much lower porosity than the density log, causing the curves to cross when displayed on the same scale.
Archie's Equation and Water Saturation
To estimate water saturation Sw in a clean formation, we use Archie's equation: Sw = ((a × Rw) ÷ (φ^m × Rt))^(1/n), where φ is porosity, Rt is true formation resistivity, Rw is formation water resistivity, and a, m, n are constants usually determined in the lab.
Calculated example with illustrative values: a = 1, m = 2, n = 2, Rw = 0.05 ohm·m, φ = 0.20, and Rt = 20 ohm·m. Thus φ^m = 0.04, numerator = 0.05, and denominator = 0.04 × 20 = 0.8. The result is 0.05 ÷ 0.8 = 0.0625, and its square root is 0.25, meaning Sw = 25%. Hydrocarbon saturation is therefore ≈ 75%.
Estimating Rw is critical because any error propagates through the entire result. To verify it, several methods are used: water catalogs, SP readings, calculating Rw from a known water zone (100% water), produced water samples, or a Pickett plot.
Is the Hydrocarbon Mobile?
The presence of hydrocarbons is not enough; they must be mobile. We compare the flushed zone saturation Sxo (near the borehole) to the uninvaded zone saturation Sw: if Sxo is significantly higher than Sw, the filtrate has displaced some hydrocarbons, meaning they are mobile. If they are close, the hydrocarbons may be immobile.
Depth Matching and Quality Control
Before interpretation, data quality must be checked: tool calibration, repeat sections to ensure stability, and reviewing the Caliper because washouts ruin density and neutron readings. Depth matching between different logs is also essential. Interpreting poor data only yields precisely wrong numbers.
Well-to-Well Correlation
The correlation question: two wells, one layer, but its depth differs by 12 m. How do we know it's the same rock? We link layers by curve patterns, not just depth, using Marker Beds like a thick shale or a distinct thin carbonate, then verify with multiple points based on local geology.
Correlation Pitfalls
- Faults (Faults): May omit or repeat parts of the stratigraphic column.
- Facies Change (Facies Change): Layer properties change laterally, so curves do not look alike.
- Pinch-out (Pinch-out): The layer disappears between the two wells.
- Thickness variations due to deposition or dip.
Examples and numbers are for educational purposes. Real interpretation requires lab data and company standards.